
Introduction
Welcome to the world of Raspberry Pi, where enthusiasts and makers harness the power of this tiny computer for various projects. Whether you’re building a home automation system, a media server, or a retro gaming console, it’s crucial to keep an eye on your Raspberry Pi’s resources. In this guide, we’ll make Raspberry Pi resource monitoring easy and accessible with the top tools and techniques. By the end, you’ll be equipped to optimize your Pi’s performance effortlessly.

Table of Contents
Understanding Raspberry Pi Resource Monitoring
Before we dive into the tools and techniques, let’s explore why resource monitoring is essential for your Raspberry Pi.
Why Resource Monitoring Matters
Raspberry Pi devices have limited resources, including CPU power, memory, and storage. Without proper monitoring, you might encounter issues like overheating, sluggish performance, or even crashes. Resource monitoring ensures your Pi runs smoothly and efficiently.
Common Challenges
Without adequate monitoring, you may face challenges like not knowing when your Pi is running hot, struggling to identify resource-hungry processes, or failing to optimize your system effectively. But fear not; we’re here to simplify it all.
Top Tools for Raspberry Pi Resource Monitoring
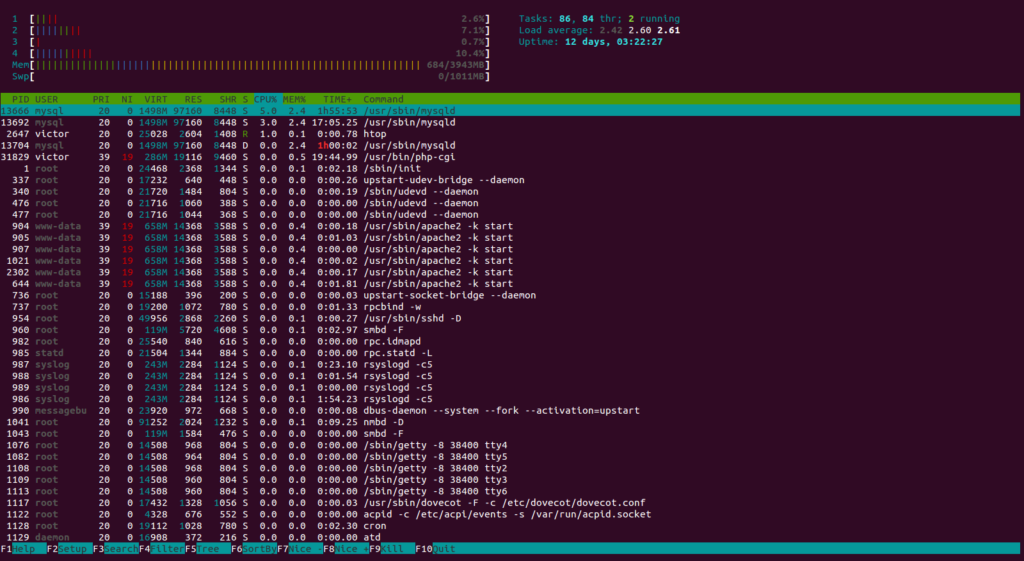
Tool 1: htop – A Visual Delight
Why htop?
Htop is a powerful, user-friendly resource monitor that provides real-time insights into your Raspberry Pi’s performance. With its interactive, colorful interface, you can easily spot resource-intensive processes, memory usage, and CPU load.
How to Install htop
Open your terminal and type:
sudo apt install htop
Once installed, run htop by typing htop in the terminal.
Tool 2: bashtop – Simplicity Meets Functionality
Why bashtop?
Bashtop is a lightweight, terminal-based resource monitor that’s perfect for Raspberry Pi. Its minimalistic design doesn’t compromise on features. You can track CPU usage, memory, temperature, and more with ease.
How to Install bashtop
Install bashtop with the following command:
sudo apt install bashtop
To start bashtop, simply run bashtop in your terminal.
Tool 3: Glances – All-in-One Monitoring
Why Glances?
Glances is an all-in-one monitoring tool that provides a comprehensive view of your Raspberry Pi’s health. It displays CPU, memory, disk, network, and sensor data in a single terminal window.
How to Install Glances
Install Glances using this command:
sudo apt install glances
To launch Glances, type glances in your terminal.
Effective Techniques for Resource Monitoring
Now that we’ve introduced our monitoring tools let’s explore some effective techniques to make the most of them.
Real-time Monitoring
Real-time monitoring with htop and bashtop allows you to instantly identify resource hogs and take action to optimize your Pi’s performance. Keep these tools open in separate terminal windows while you work on your projects.
Historical Data Analysis
Glances can log historical data. Reviewing this data can help you identify long-term trends and potential issues before they become critical. Experiment with different parameters to fine-tune your Pi’s performance.
Interpreting Monitoring Data
Understanding the data displayed by these tools is crucial. Pay attention to CPU load percentages, memory usage, and temperature. Learning to interpret this information will empower you to make informed decisions about your Raspberry Pi’s configuration.
Making Resource Monitoring Easy
Resource monitoring doesn’t have to be a daunting task. Here are some tips to simplify the process:
- Automation: Set up alerts and automation scripts to take action when resource thresholds are exceeded.
- Regular Checks: Make resource monitoring a habit. Regular checks can prevent issues before they escalate.
- Troubleshooting: Learn from your monitoring data. When issues arise, use it as a troubleshooting tool to pinpoint the root causes.
Conclusion
Congratulations! You’ve now embarked on a journey to become a resource monitoring expert for your Raspberry Pi projects. We’ve covered essential tools like htop, bashtop, and Glances, along with effective techniques to keep your Pi running smoothly.
Remember, resource monitoring is not just a one-time task—it’s an ongoing process that ensures your Raspberry Pi performs at its best. Embrace these tools and techniques, and you’ll be well-prepared for any project you undertake.
Now, it’s your turn. Start monitoring your Raspberry Pi’s resources, and unlock its full potential. If you have questions or want to share your success stories, feel free to reach out in the comments below. Happy monitoring!

Leave a Reply